
Dive
Overview
The Dive plug-in provides dataflow visualization in Ivette. It displays graphs with information provided by Eva and Studia, such as value ranges of expressions, dependency information (e.g. which memory areas impact a given expression), taint information, between others.
This information is displayed in a dynamic graph (using various layout algorithms) which can be interacted with, allowing for faster understanding of the causes of an alarm, or loss of precision during the analysis.
Quick Start
Copy the example code below into a file named dive.c, then run:
ivette -eva dive.cOpen the Dive Dataflow view in the upper right corner.
An alarm (represented with an ACSL annotation) will be present before the arr[1] = 1; statement in the AST panel. Click on it, and you should obtain a graph similar to the one below.
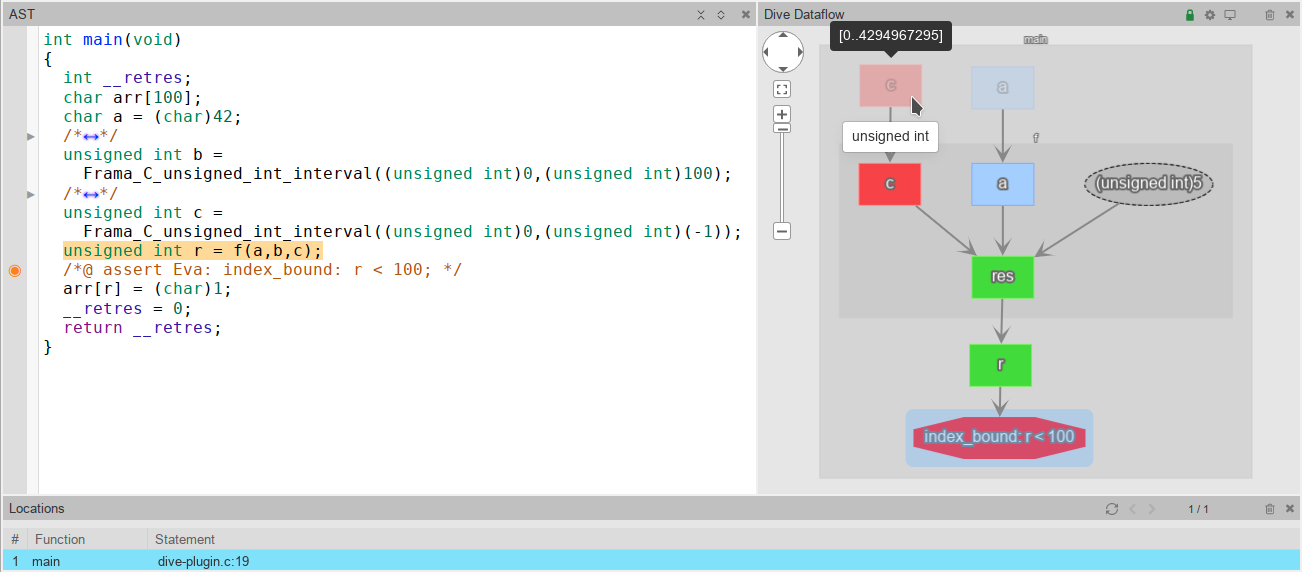
You can click to expand nodes, and hover to obtain the value range as well as the value type. The node color indicates the precision of the value range. Arrows point from each dependency to its dependent location.
Example code
// dive.c
#include <__fc_builtin.h>
volatile int nondet;
unsigned f(char a, unsigned b, unsigned c) {
  unsigned res;
  if (b > 10) {
    res = 5;
  } else if (b > 1) {
    res = a;
  } else {
    res = c / 2;
  }
  return res;
}

int main(void) {
  char a = 42;
  unsigned b = Frama_C_unsigned_int_interval(0, 100);
  unsigned c = Frama_C_unsigned_int_interval(0, (unsigned)-1);
  unsigned r = f(a, b, c);
  char arr[100];
  arr[r] = 1; // alarm
  return 0;
}
Technical Notes
Maturity: experimental
Automatically available in Ivette; results displayed in Dive Dataflow view when Eva has been executed.