The Eva Abstract Debugger: A new way to explore and interact with the Frama-C/Eva static analyzer
Jules Massart - 2nd Feb 2026This is an invited post by Jules Massart on his 6-month internship (from March to August 2025) in the Frama-C team, where he developed the Eva Abstract Debugger under the supervision of Michele Alberti, David Bühler, and Virgile Prevosto. Building on the original idea of Abstract Debuggers [1], Jules shows how this concept is adapted in Frama-C/Eva to support on-the-fly, interactive guidance of the analysis, rather than post-hoc exploration of its results. He then explains how the transition to Weak Partial Orders [2] enables interactive branch exploration. Together, these advances turn abstract interpretation into an interactive, explorable, and developer-oriented debugging experience.
The Frama-C team plans to make the Eva Abstract Debugger available as part of the next Frama-C release.
What is an Abstract Debugger?
When developers think of debugging, they usually picture running a program step by step, inspecting variables, and stopping at breakpoints until they find the root cause of a bug. This is classical debugging. It executes on a single input, follows a single control-flow path, and shows the exact values of variables along such execution. This approach is extremely useful but limited because if a bug does not appear during a particular execution, it will go unnoticed.
An abstract debugger applies the same interactive principles (breakpoints, stepping, and variable inspection) to abstract interpretation-based program analysis. Instead of concrete states where variables hold a single value, it manipulates abstract states, which characterize all possible values of the program variables at a given program point.
Classical vs Abstract Debugging
| Aspect | Classical Debugger | Abstract Debugger |
|---|---|---|
| Execution Model | Runs the program with specific inputs | Analyzes the program statically without execution |
| State Representation | Concrete values (e.g., x = 7) | Abstract domains (e.g., x ∈ [0, 10]) |
| Coverage | Single execution path | All possible execution paths simultaneously |
| Bug Detection | Finds bugs that manifest in the tested execution | Finds bugs that could manifest in any execution |
| Stepping | Executes next instruction | Propagates abstract states through a statement |
| Breakpoints | Pauses program execution | Pauses the analysis |
| Inspection | Shows exact variable values | Shows variable domains and abstract states |
| Use Case | Reproducing and diagnosing known bugs | Understanding analysis results and exploring potential bugs |
The concept of abstract debugging was originally proposed by Holter et al. [1] as a method to explore the results of a completed analysis. Their work focused on navigating the resulting abstract states once the analysis had finished.
The Eva Abstract Debugger goes a step further by enabling on-the-fly interaction with the analyzer during its execution. Instead of only inspecting final results, the user can pause the analysis, advance it step-by-step, or focus on specific functions or program points. This turns the abstract debugger from a mere viewer of analysis outcomes into an active aid for understanding and guiding the verification process.
Why is it useful in Eva?
Eva is a Frama-C plug-in based on Abstract Interpretation, designed to prove the absence of runtime errors in C programs. However, its results can sometimes be difficult to interpret: since we observe abstract values merging all possible paths, understanding where these values come from, and whether we have a true problem or an artifact of the overapproximations that have been done (i.e. a false alarm) is often a long and tedious exercise.
With an abstract debugger, Eva becomes more flexible as users can interact with it in the following ways.
- Trace alarms back to the abstract states that triggered them.
- Step through the analysis, and watch how values propagate.
- Guide the analysis by selecting branches, adding assumptions and instructions.
For newcomers, the familiar debugging concepts lower the barrier to formal verification.
Key Features
The Eva Abstract Debugger is available through a VSCode extension that is hooked to the Frama-C engine, communicating via the Debug Adapter Protocol (DAP).
It features:
- Step-by-step execution of the analysis.
- Breakpoints, including conditional breakpoints based on ACSL predicates.
- Branch selection at control-flow junctions.
- On-the-fly annotations to refine the analysis.
- Visual inspection of variable domains, call stacks and abstract states.
- Live alarms and logs from Frama-C.
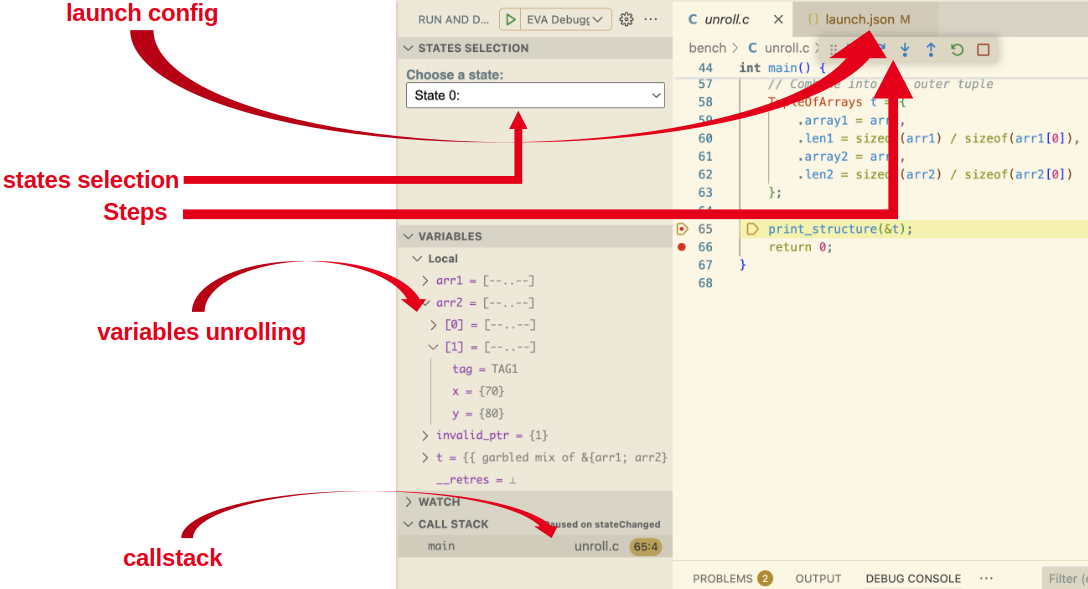
Debugging session in VSCode with the Eva Abstract Debugger
Eva Abstract Debugger tutorial
From WTO to WPO: A Technical Evolution in Eva’s Core
Building the abstract debugger required a significant evolution of Eva’s core architecture, namely the transition from Weak Topological Orders (WTO) to Weak Partial Orders (WPO) [2]. This change enables interactive branch selection during abstract debugging, allowing developers to choose the order in which the analyzer processes the different control-flow paths arising at branch points.
Traditionally, Eva relied on WTOs, which impose a total hierarchical ordering on the control-flow graph. By extending topological sorting to cyclic graphs, WTOs provide a deterministic ordering for fixpoint computation, ensuring that abstract states are propagated and consolidated in a well-defined sequence across the entire program.
However, such a total ordering is ill-suited for interactive analysis. Because a WTO linearly orders even independent control-flow paths, it fixes the order in which abstract states are computed at branch points. Consequently, the analyzer must follow this predefined order, regardless of which branch or path is of immediate interest to the user.
This limitation motivated the transition to WPOs. By representing only the necessary ordering constraints, WPOs leave independent paths unordered. This allows the analyzer to defer ordering decisions and enables user-driven selection of the order in which independent control-flow paths are analyzed during abstract debugging.
Consider this control-flow graph:
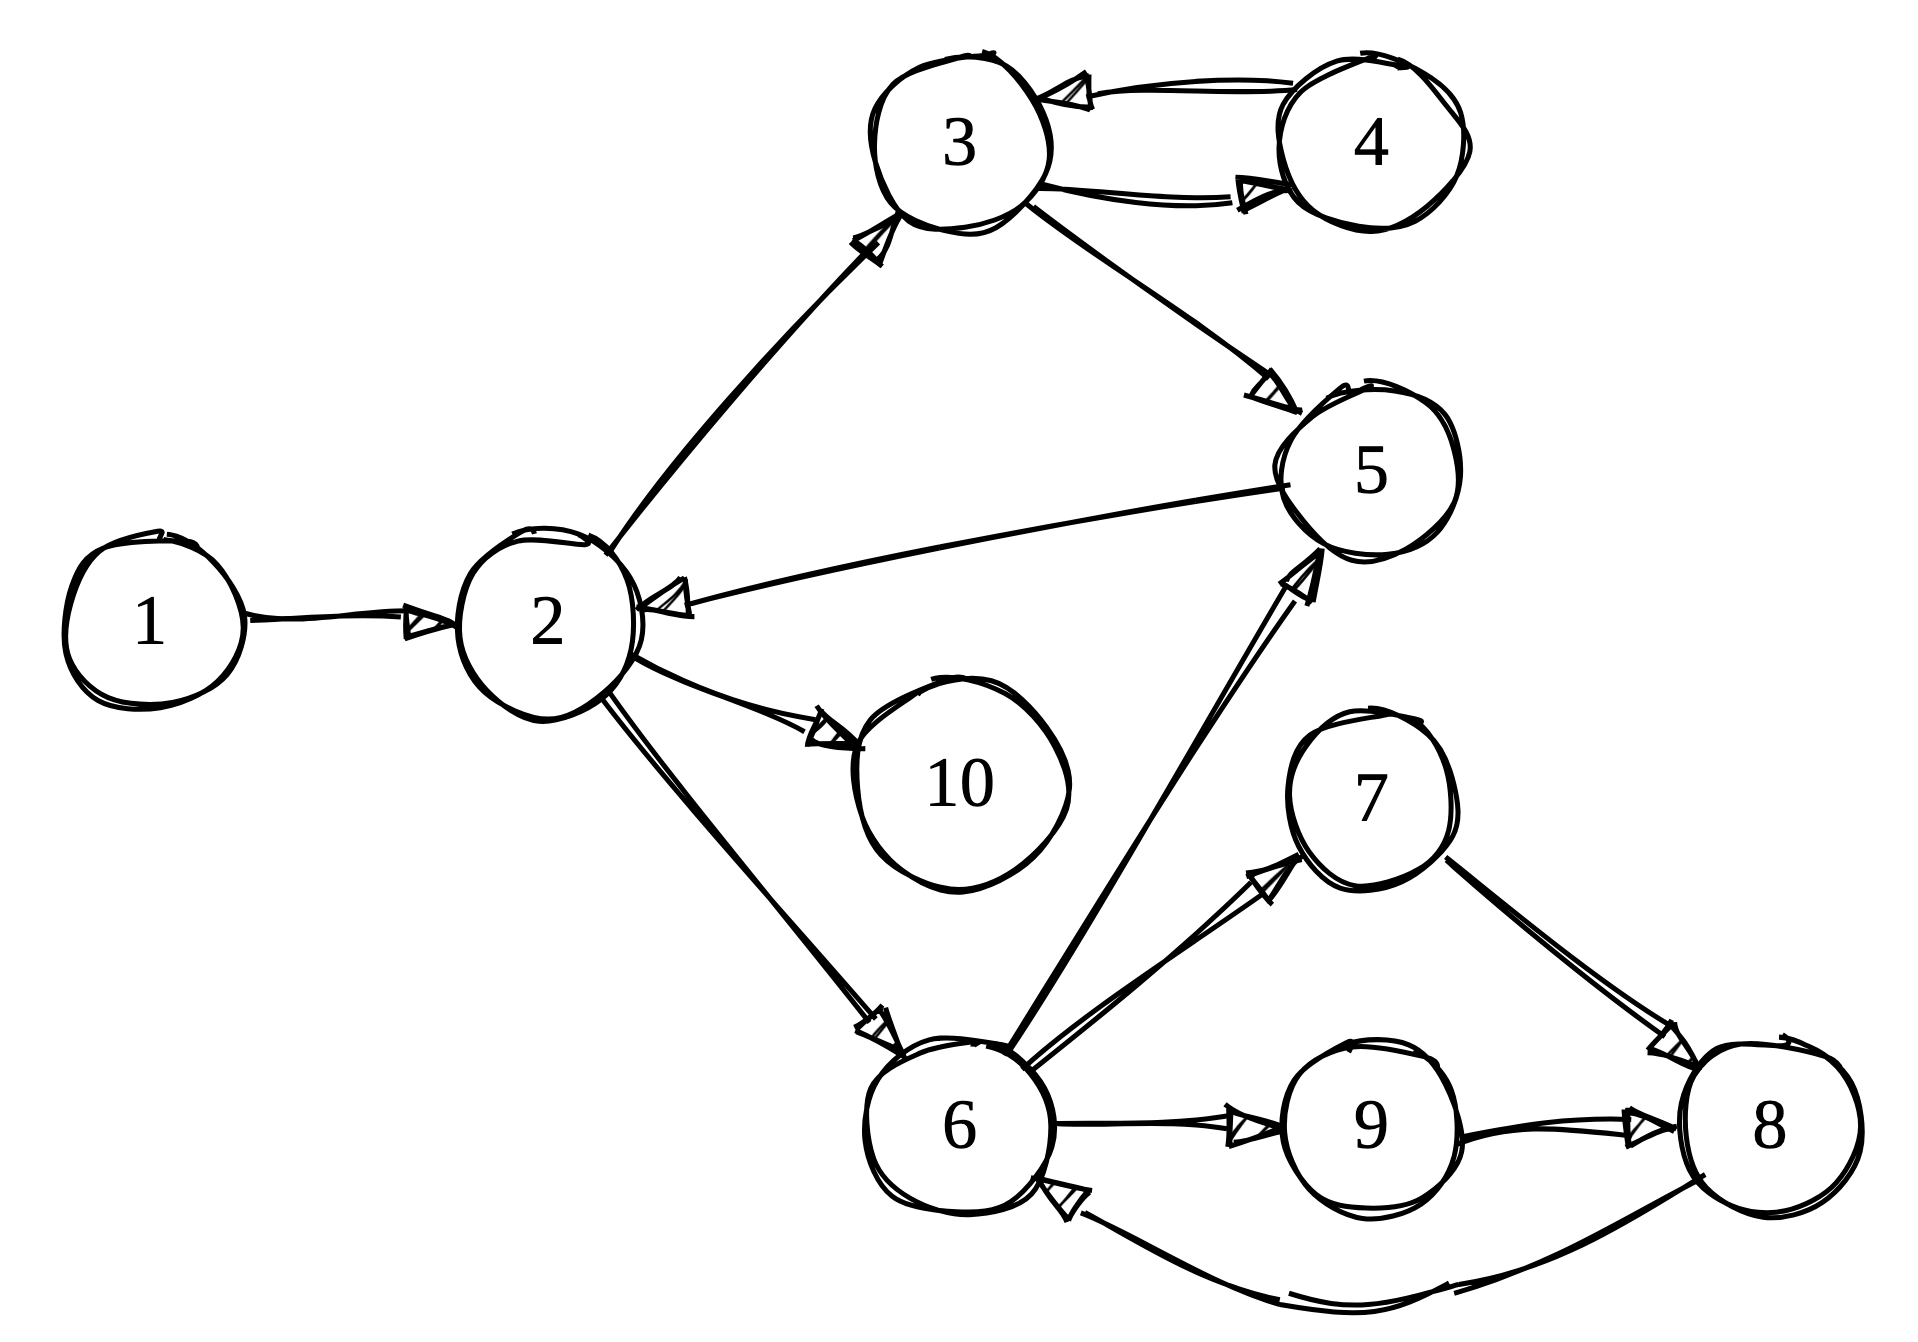 Example control-flow graph G1
At node 2, the program can branch to either node 3 or node 6. These branches are independent, yet WTO forces a specific traversal order:
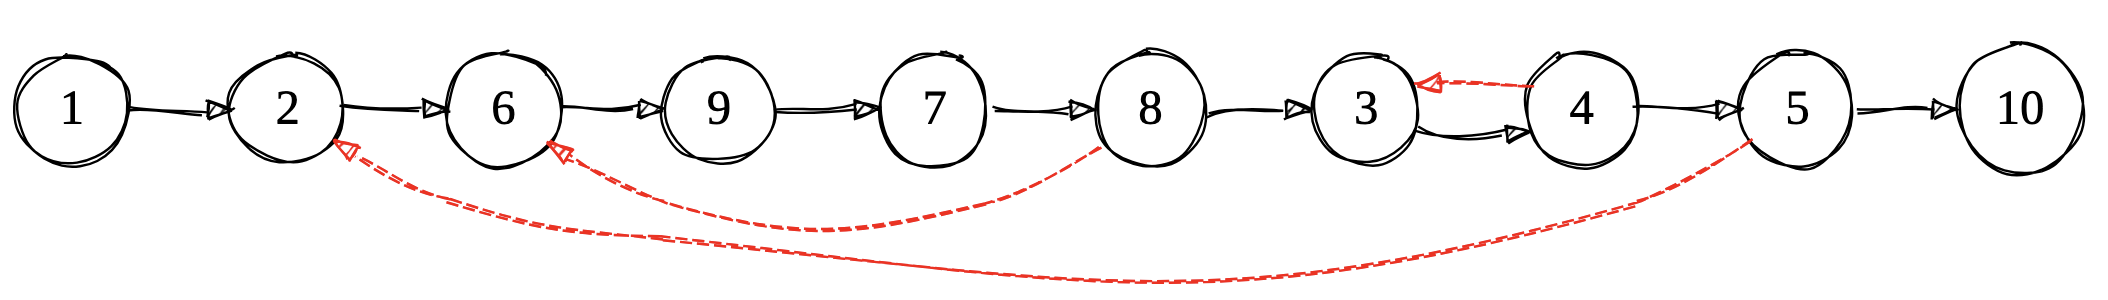 WTO representation (red arrows mark loop boundaries)
In this WTO, we must visit node 6 before node 3, even though they are independent branches.
For a classical analysis, this is not problematic as all nodes must be visited anyway for soundness. But for interactive debugging, this rigidity becomes a significant limitation.
Consider a typical debugging scenario:
if (user_input > 0) {
  process_positive();  // Branch A
} else {
  process_negative();  // Branch B
}
With the WTO, the analyzer has already decided the exploration order (say, Branch A then B). If the bug is in Branch B, user would be forced to wait while the analyzer explores Branch A first. This is a potentially time-consuming process for complex branches.
In interactive debugging, users often have hypotheses about where bugs might be. Being forced to follow a predetermined path wastes time exploring irrelevant branches instead of focusing on the suspicious code.
WPOs remove unnecessary ordering constraints while preserving analysis correctness through a hierarchical partial order. Independent branches remain unordered, giving users the freedom to choose their exploration path.
WPOs use two types of edges to encode control-flow relationships:
- Scheduling edges (black): Encodes “must happen before” dependencies.
- Stabilization edges (red): Encodes “component must reach fixpoint” for loops.
Here is the same graph represented as a WPO:
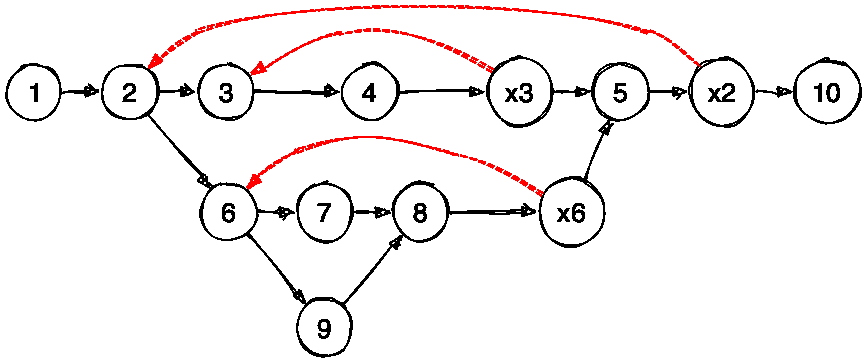 WPO representation of G1
From node 2, we can now explore either node 6 or node 3 without any restriction!
Like WTOs, WPOs organize cycles of a control-flow graph into components, on which the analyzer iterates until the corresponding abstract state reaches a fixpoint, meaning the loop has stabilized. Unlike WTOs, WPOs allow exploration of independent components, by following two simple rules:
- Predecessor rule: A node can be explored as long as all its predecessors have been processed.
- Stabilization rule: Control-flow can only leave a loop component once it has stabilized.
Here’s an animation showing the WPO iteration in action (assuming each loop requires two iterations to stabilize):
 WPO iteration visualization (Blue: visited, Green: loop stabilized, xNode: exit nodes)
Note that, from exit node 6, we cannot directly proceed to node 5 because one of its predecessors (exit node 3) has not been visited yet. Following the predecessor rule, we backtrack to the last common ancestor and explore node 2’s other successor: node 3. This backtracking behavior emerges naturally from a depth-first search traversal.
This transition to WPO is what makes interactive abstract debugging possible in Eva. Users can now:
- Choose which branch to explore first based on their debugging hypotheses.
- Skip irrelevant branches temporarily and return to them later.
Conclusion
The Eva Abstract Debugger turns static analysis in Frama-C from a passive process into an interactive experience. By leveraging Weak Partial Orders, it enables developers to steer the analysis and examine complex abstract states using familiar debugging workflows. This approach makes formal program analysis more accessible and practical, lowering the barrier for developers to integrate rigorous analysis tools into everyday software development.
References
[1] Karoliine Holter, Oskar Juhan, Patrick Lam, Simmo Saan, and Vesal Vojdani. “Abstract Debuggers: Exploring Program Behaviors using Static Analysis Results” In Proceedings of the 2024 ACM SIGPLAN International Symposium on New Ideas, New Paradigms, and Reflections on Programming and Software (Onward!) 2024
[2] Sung Kook Kim, Arnaud J. Venet, and Aditya V. Thakur “Deterministic parallel fixpoint computation” In Proceedings of the ACM on Programming Languages (POPL), 2020